Live tree, grass and weed pollen index
Pollen Count Today in My Area
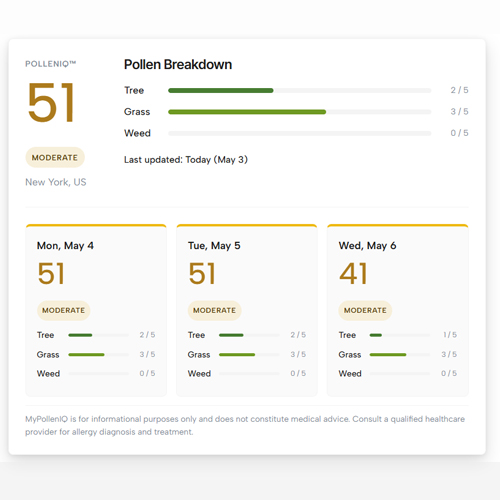
Check today’s pollen count for tree, grass and weed pollen in your area. Enter your ZIP code for a live PollenIQ™ score.
Tree, Grass and Weed Pollen Count Today
Most allergy trackers treat pollen as one thing. It is not. Tree pollen, grass pollen, and weed pollen each have their own season, their own peak window, and their own trigger species. Knowing which type is high today tells you far more than a single combined number ever could.
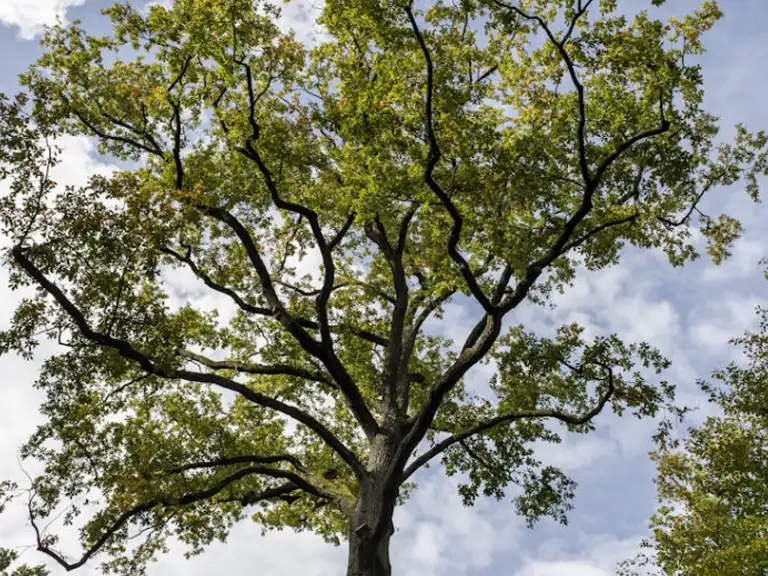
Tree pollen count today
Tree pollen hits first. Every year, before grass season starts and long before ragweed appears, trees release billions of pollen grains into the air across North America.
Birch, oak, cedar, and maple are the main triggers. In the South, mountain cedar can peak as early as December. In northern states and Canada, birch typically dominates from March through May. A single birch tree releases up to five million grains per day at peak season.
If your symptoms start in late winter or early spring, tree pollen is almost always the cause. The PollenIQ™ score weights tree pollen at 45% of the composite index reflecting how dominant it is across the allergy calendar.
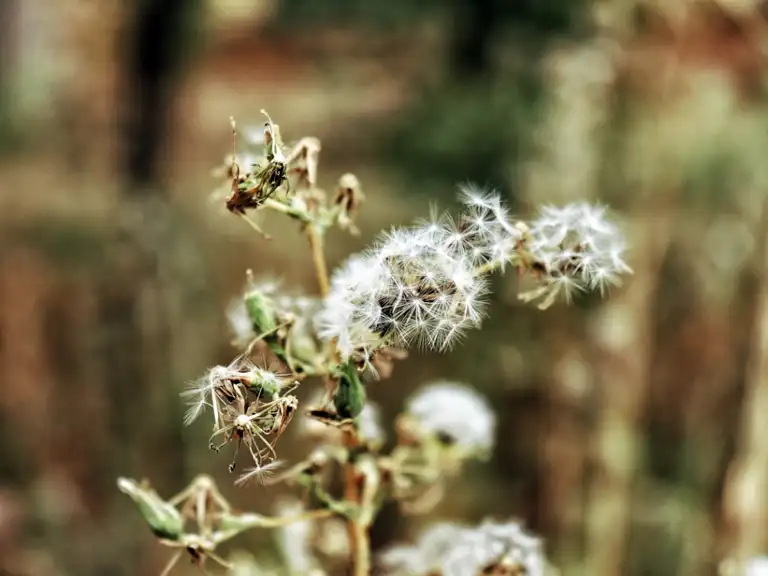
Weed pollen count today
Weed pollen season catches people off guard. After a summer of managing tree and grass allergies, ragweed arrives in August and does not let up until the first frost.
One ragweed plant produces up to one billion pollen grains in a single season. It travels far. Ragweed pollen has been detected 400 miles offshore and two miles up in the atmosphere. Being indoors does not fully protect you. It comes through windows, vents, and clothing.
Weed pollen also includes plantain, mugwort, and sagebrush depending on your region. In the PollenIQ™ score, weed pollen carries a 20% weight. Lower than tree and grass, but concentrated and intense during peak weeks.
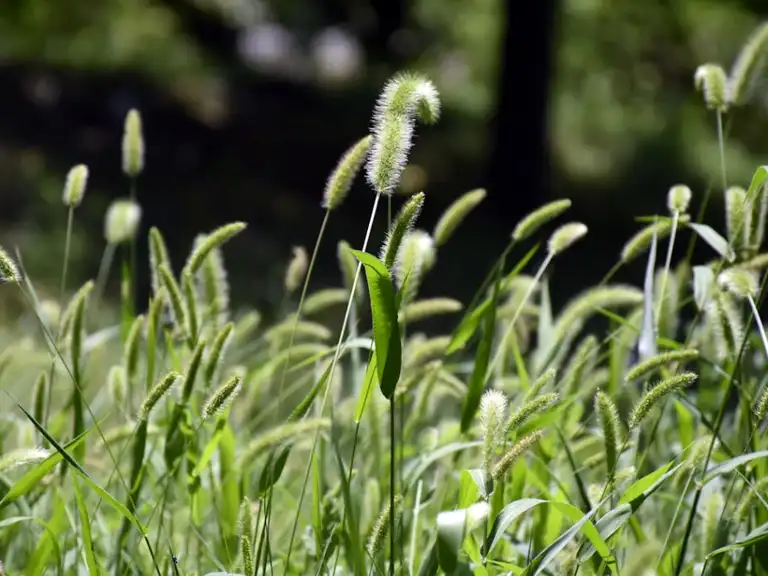
Grass pollen count today
Grass pollen runs the longest season of the three. From late spring through mid-summer, timothy, Bermuda, Kentucky bluegrass, and ryegrass release pollen across most of the country.
Unlike tree pollen, which has a defined peak window, grass pollen levels fluctuate daily based on temperature, wind, and humidity. Levels are highest on warm, dry, windy afternoons. They drop after rain. Not for long, but enough to notice.
The grass pollen calendar runs from May through August in most northern states. In warmer southern states like Florida and Texas, grass pollen can be present almost year-round. The PollenIQ™ score weights grass pollen at 35%.
AS Featured On


Real-time data, updated daily
Pollen levels change fast. MyPollenIQ pulls live data from Google’s Pollen API every day across 40 cities in the USA and Canada. You get today’s count, not last week’s average.
The PollenIQ™ composite score
Raw pollen counts are hard to interpret. The PollenIQ™ score converts tree, grass, and weed pollen levels plus local air quality into a single 0 to 100 number. One score. Clear risk level. No guessing.
Three allergen types, tracked separately
Most trackers give you one number. We give you three. Tree, grass, and weed pollen are tracked independently so you know which allergen is causing your symptoms today, not just whether pollen is high.
City-level forecasts for high-allergy areas
We cover the 20 highest-allergy cities in the USA and Canada, selected from the AAFA 2026 Allergy Capitals report and Aerobiology Research Laboratories 2026 data. These are the cities where pollen levels matter most.
Why accuracy matters
The Most Accurate Pollen Count App: Here Is Why
Hay fever does not give you a warning. One morning you are fine, the next you cannot leave the house without antihistamines. A daily PollenIQ™ alert changes that.
Sign up and we send one email per day during peak pollen season with your city’s score. No weather noise. No spam. Just the number you need to plan your morning.
Today’s Pollen Count – Top US Cities
Live PollenIQ™ scores for the highest-allergy cities in the USA. Updated daily. Select any city for the full tree, grass and weed pollen breakdown.
Pollen levels right now
Live PollenIQ™ scores updated daily, select your city for the full forecast.
How it works
What Is the Pollen Count – and What Does PollenIQ™ Actually Measure?
Most pollen trackers show you one raw number from a single sensor. That number tells you tree pollen is at level 4. It does not tell you whether that is bad for you today, whether air quality is making it worse, or whether grass is about to spike at the same time.
The PollenIQ™ score measures your actual allergy risk. Not just what is in the air.
Pollen Count Today: What You Need to Know
Six questions we get asked most often about pollen tracking, the PollenIQ™ score, and how to read your allergy forecast.
Questions about pollen tracking and the PollenIQ™ score
The pollen count in your area changes every day based on temperature, wind speed, humidity, and which plants are currently releasing pollen. Enter your ZIP code in the tool above and MyPollenIQ will pull today’s live tree, grass and weed pollen levels for your location using Google’s Pollen API data.
Whether pollen is high today depends on your location, the current season, and which allergen types are active. A PollenIQ™ score above 60 indicates high conditions. Above 80 is very high. Enter your ZIP code above to see today’s exact level for your city. During peak hay fever season, levels above 60 are common across most US cities.
Pollen data is updated once per day, typically in the early morning hours. The data comes directly from Google’s Pollen API, which aggregates readings from monitoring stations and atmospheric modelling across North America. You are always seeing today’s count, not a running average.
Most pollen trackers display a raw Universal Pollen Index value from one allergen type. The PollenIQ™ score combines all three allergen types, adjusts for local air quality, and applies a seasonal intensity multiplier. It is designed to reflect your overall allergy risk more accurately than a single raw reading from a single source.
MyPollenIQ currently covers the 20 highest-allergy cities in the USA and the 20 highest-allergy cities in Canada. US cities were selected from the AAFA 2026 Allergy Capitals report. Canadian cities were selected from the Aerobiology Research Laboratories 2026 Pollen Report. Coverage will expand to the UAE and UK in the next phase.
es, completely free. We cover operating costs through affiliate partnerships with allergy-related products. If you purchase something we recommend, we may earn a small commission at no extra cost to you. Every product we recommend is selected based on allergen-season relevance, not commission rate.
